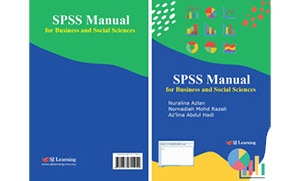
SPSS Manual for Business and Social Sciences: Nuralina Azlan, Nornadiah Mohd Razali and Az'lina Abdul Hadi (2026)

SPSS Manual for Business and Social Sciences


ISBN 978-967-2711-25-4 – Contents in 4-colour

About the Authors

Nuralina Azlan
Nuralina Azlan is a Statistics lecturer at the Centre of Statistical and Decision Sciences Studies, College of Computing, Informatics and Mathematics, Universiti Teknologi MARA Negeri Sembilan. She has been teaching statistics since 2011 and supervises undergraduate students. She holds a Bachelor of Science (Hons.) Statistics and Master of Science in Applied Statistics from Universiti Teknologi MARA, Shah Alam. Her main areas of research interests are Statistical Modelling, Applied Statistics and Multivariate Analysis.
Nornadiah Mohd Razali
Nornadiah Mohd Razali is a Statistics lecturer at the Centre of Statistical and Decision Sciences Studies, College of Computing, Informatics and Mathematics, Universiti Teknologi MARA Negeri Sembilan. She has been teaching and supervising undergraduate statistics students since 2010. She obtained her Diploma in Statistics, Bachelor of Science (Hons.) Statistics and Master of Science in Applied Statistics from Universiti Teknologi MARA, Shah Alam. Her main areas of research interests are Statistical Modelling, Applied Statistics, Statistical Computing (SAS Programming) and Experimental Design.
Az’lina Abdul Hadi
Az’lina Abdul Hadi is a Statistics lecturer at the Centre of Statistical and Decision Sciences Studies, College of Computing, Informatics and Mathematics, Universiti Teknologi MARA Negeri Sembilan. She has been teaching statistics since 2010 and supervises postgraduate as well as undergraduate students. She holds B.Sc in Statistics from Universiti Teknologi MARA, Shah Alam and M.Sc in Applied Statistics from Universiti Putra Malaysia. She has published several papers in her area of specialisation. Her main areas of research interests are Statistical Modelling, Applied Statistics in Social Sciences, Nonparametric Statistics and Experimental Design.

Table of Contents

Table of Contents

About the Authors iii
Table of Content iv
1.0 GETTING STARTED WITH IBM SPSS 2
2.0 SETTING UP YOUR DATA IN SPSS 4
3.0 DESCRIPTIVE STATISTICS 10
3.1 How to Produce a Frequency Table for Qualitative Variable? 10
3.2 How to Produce a Crosstabulation Table for Two Categorical Variables? 15
3.3 How to Produce a Simple Bar Chart for a Qualitative Variable? 16
3.4 How to Produce a Clustered Bar Chart for Two Qualitative Variables? 18
3.5 How to Produce a Stacked Bar Chart for Two Qualitative Variables? 20
3.6 How to Produce a Pie Chart for a Qualitative Variable? 22
3.7 How to Produce Descriptive Statistics for Quantitative Variables? 24
3.8 How to Produce Descriptive Statistics for Quantitative Variables? (Alternative Method) 30
3.9 How to Produce a Boxplot for Quantitative Variables? 33
4.0 ONE SAMPLE T TEST 35
5.0 INDEPENDENT T TEST 38
6.0 PAIRED T TEST 43
7.0 ONE-WAY ANALYSIS OF VARIANCE (ANOVA) 46
8.0 CORRELATION AND SIMPLE LINEAR REGRESSION 52
8.1 Scatter Diagram 54
8.2 Pearson’s’ Correlation Coefficient, r 56
8.3 Regression 58
9.0 CHI-SQUARE TEST OF INDEPENDENCE 60
Index 69

Instructors Supplements

Please login to download